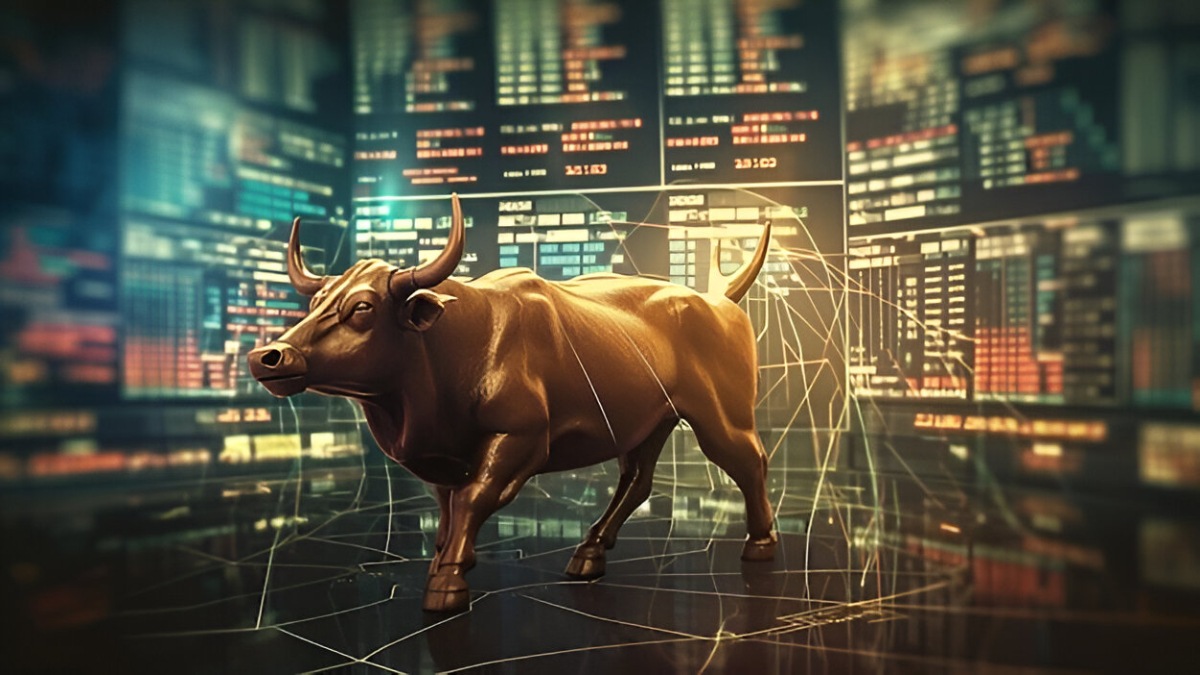
With its shifting fortunes, changing consumer tastes, and ongoing pressure from technology change, the Indian car industry has been an interesting place to observe. The Nifty Auto Index is a key indicator for investors following this important sector of the Indian economy since it shows the overall performance of the top automakers and suppliers of auto parts in the nation. This index has generated a lot of interest lately, and some analysts believe that the Bullish Black Swan, a potentially potent bullish reversal pattern, is about to appear.
A prerequisite to investigating the nuances of the Nifty Auto Index is comprehending the Bullish Black Swan pattern. A Black Swan event is typically seen in technical analysis as an uncommon, erratic occurrence that has a big influence. However, the Bullish Black Swan pattern is a particular candlestick pattern that indicates a great potential for an upside price reversal, even though it incorporates the "Black Swan" label due to its sudden arrival following a period of bearish momentum.
This pattern, which is typified by a long bearish candlestick that gaps down abruptly and frequently breaks through prior support levels, usually develops following a strong downtrend. This first action may incite panic and increase pressure to sell. The swift and violent rejection of this reduced price, however, is the Bullish Black Swan's most important component. The following trading day sees a powerful bullish candlestick that, ideally, closes within or even above the body of the previous bearish candle in addition to closing above the low of the "Black Swan" day.
A significant psychological rationale exists for the Bullish Black Swan. Many traders are frequently caught off guard by the initial steep downturn, which increases short positions and triggers stop-loss actions. The ensuing robust buying, however, suggests a notable change in mood. It implies that either strong purchasers have come in forcefully, absorbing the selling pressure and creating a new, higher demand level, or that the initial bearish move was an overreaction. From a technical analyst's viewpoint, the pattern's "Black Swan" characteristic arises from the sharp and unforeseen upward price movement succeeding a bearish interval.
The Nifty Auto Index has been under downward pressure for the previous few weeks due to a number of causes, including shifting regulatory environments, global economic uncertainty, and fluctuating raw material prices. Some investors may have adopted a cautious stance on the industry as a result of this adverse trend. However, a closer look at the index's recent price activity is necessary to determine whether a Bullish Black Swan pattern is likely to materialize.
Although it's crucial to remember that spotting a Bullish Black Swan necessitates closely examining candlestick patterns throughout several trading sessions, some price movements in the Nifty Auto Index have traits that are similar to this potent reversal indicator. A notable, sharp downward price gap, quickly followed by a robust bullish engulfing candle, could act as a clear indication that a Bullish Black Swan is currently unfolding that closes much above the low of the down gap.
The Bullish Black Swan is not infallible, just like any other technical analysis pattern. Before acting on this signal alone, it is important to get confirmation. There are several ways to obtain confirmation, including:
Follow-through buying: Ideally, prices will continue to rise and hit higher highs and lows in the following trading days.
A higher-than-normal trading volume should ideally accompany the bullish reversal day and the days that follow, demonstrating a strong sense of conviction behind the purchasing demand.
Support from additional technical indicators: The argument for a Bullish Black Swan-led reversal can be reinforced by observing bullish signs from additional indicators, such as moving averages, RSI (Relative Strength Index) divergence, or MACD (Moving Average Convergence Divergence) crossover.
The ramifications for investors could be substantial if the Nifty Auto Index does, in fact, validate a Bullish Black Swan pattern. It would imply that there is a good chance the index will rise steadily, signifying fresh hope and enthusiasm in investing in the auto industry. For investors holding auto stocks or related ETFs, this might result in profitable returns.
On the Nifty Auto Index, a successful Bullish Black Swan could potentially portend a more general change in the way the market views the industry. It could mean that new positive catalysts are emerging or that the elements that were previously depressing the index are waning. Improved economic growth, government assistance for the auto sector, the introduction of successful new products, or a favorable change in consumer demand are a few examples of these catalysts.
But it's also critical to be mindful of the possible hazards. Further declines may result from a failed Bullish Black Swan pattern, in which the following price action does not support the original bullish signal. To safeguard their money, investors should thus always use sensible risk management techniques, such as placing stop-loss orders.


Download the App Today